New release
A new version of the GLEAMviz simulator has been released today: version 7.0 features a major rewriting of all the data handling components, together with some additional functionalities.
The output format for the results generated by the computational engine and managed by the client has been changed to a standard format, the Hierarchical Data Format version 5 (HDF5), developed by the NCSA; this change brings various advantages, in terms of scalability and extension of the output data, performances, and usability. Along with this modification we performed a significant architectural refactoring of all the data manager modules, adjourning the data retrieval process (which is now much faster) and setting the basis for future improvements and extensions in handling the simulations’ output.
The new software application is not compatible with the old custom data format, so we developed a simple conversion tool to allow users adjourn their existing simulations to the new format, and then open them in the Client version 7 for visualizing and analyzing. The conversion tool is distributed together with the GLEAMviz client and is called GLEAMconverter; its usage is straightforward: you just need to select one or more simulations (up to version 6.9) and an output directory.
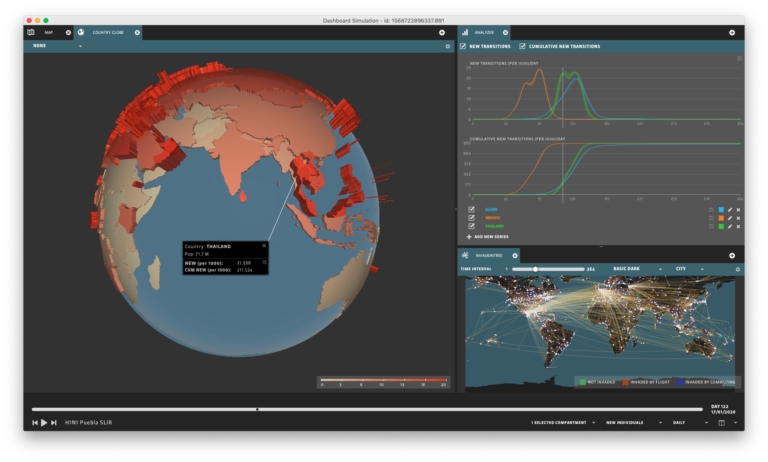
The newly released Client also introduces a new visualization widget, the X3D Globe, which shows the incidence (new transitions) at the country level by means of 3D choropleth shapes on the Earth globe; the coloring range and other visualization options can be specified by the user.
Finally, version 7.0 also includes various improvements and bug-fixes both client-side and server-side: we do our best to continuously upgrade the GLEAMVIZ simulator!
New release
Announcement
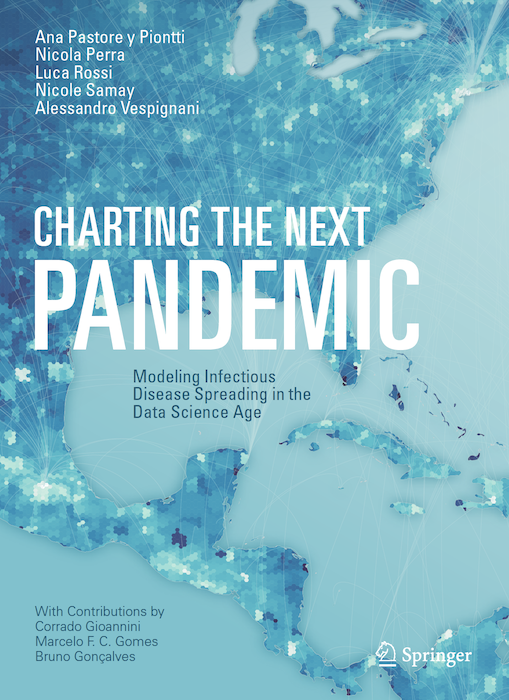
This book provides an introduction to the computational and complex systems modeling of the global spreading of infectious diseases. The latest developments in the area of contagion processes modeling are discussed, and readers are exposed to real world examples of data-model integration impacting the decision-making process. Recent advances in computational science and the increasing availability of real-world data are making it possible to develop realistic scenarios and real-time forecasts of the global spreading of emerging health threats.
The first part of the book guides the reader through sophisticated complex systems modeling techniques with a non-technical and visual approach, explaining and illustrating the construction of the modern framework used to project the spread of pandemics and epidemics. Models can be used to transform data to knowledge that is intuitively communicated by powerful infographics and for this reason, the second part of the book focuses on a set of charts that illustrate possible scenarios of future pandemics. The visual atlas contained allows the reader to identify commonalities and patterns in emerging health threats, as well as explore the wide range of models and data that can be used by policy makers to anticipate trends, evaluate risks and eventually manage future events.
Charting the Next Pandemic puts the reader in the position to explore different pandemic scenarios and to understand the potential impact of available containment and prevention strategies. This book emphasizes the importance of a global perspective in the assessment of emerging health threats and captures the possible evolution of the next pandemic, while at the same time providing the intelligence needed to fight it. The text will appeal to a wide range of audiences with diverse technical backgrounds.
New release
Dear users, we are glad to announce a new release of our simulator client: version 6.8 includes some important refactoring of the visualization components and bug-fixes, together with a few new powerful features for analyzing the simulations’ output results.
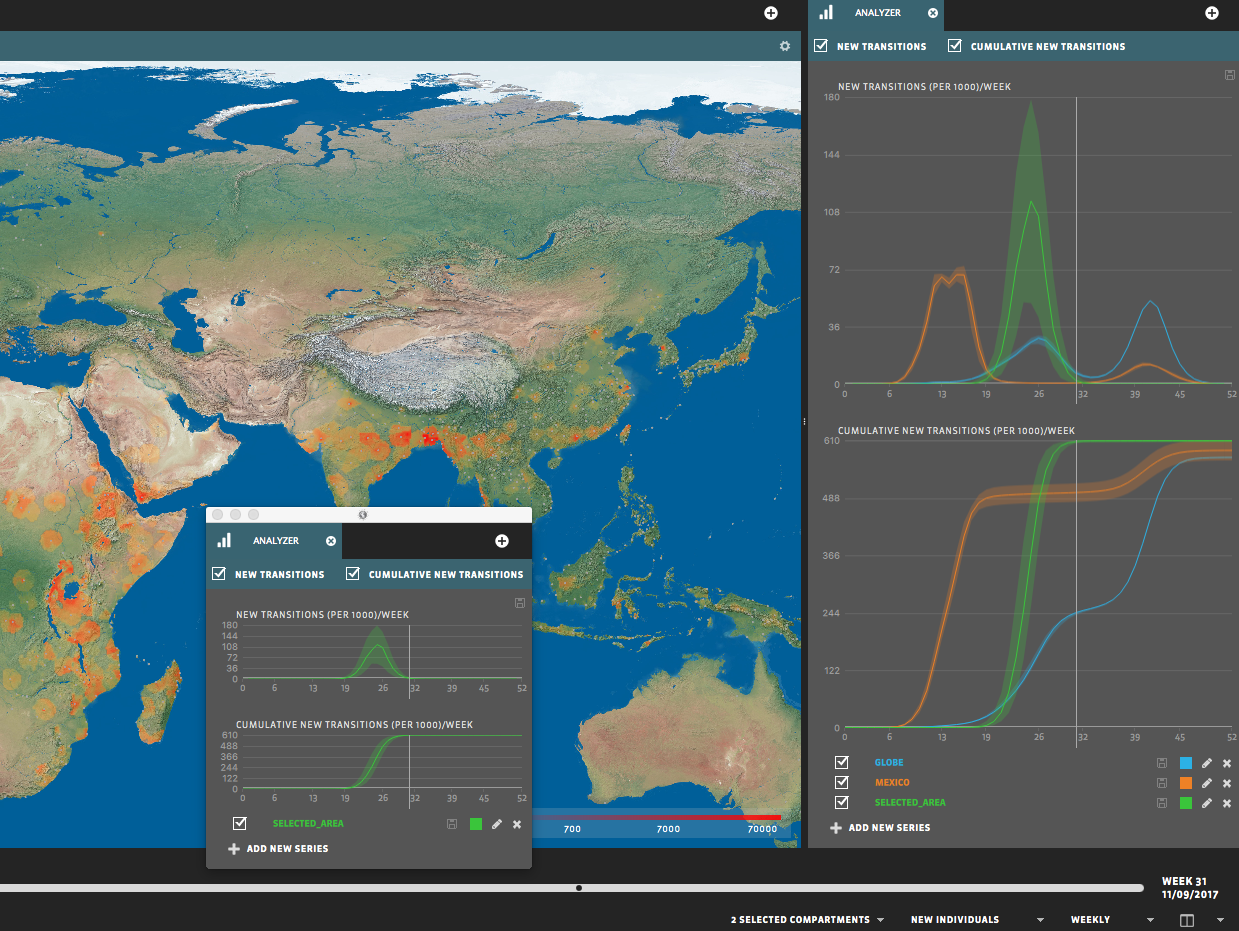
The updated map widget allows to select an arbitrary region by pressing the Ctrl/Command key and while holding it down clicking and dragging with the mouse. This results in opening an Analyzer widget showing the epidemic curves for the selected area. Another very useful feature is the possibility to click on a data series within an Analyzer and drag it to another Analyzer widget, dropping it there making easy to perform an immediate comparison with other ones.
Other minor improvements have been introduced in terms of usability, and in handling the remote simulations.